We have compiled a list of manufacturers, distributors, product information, reference prices, and rankings for Graph creation software.
ipros is IPROS GMS IPROS One of the largest technical database sites in Japan that collects information on.

Graph creation software(asic) - List of Manufacturers, Suppliers, Companies and Products | IPROS GMS

Graph creation software Product List

1~2 item / All 2 items

Displayed results

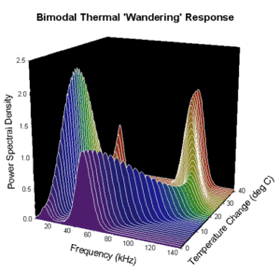
Specialized graph creation software for scientific technology, 'SigmaPlot'.

Analysis and graph creation that elevates research results to the highest expression.

It is a cutting-edge graph creation program designed for the Windows platform, specifically for academic purposes. The software specializes in graphically representing research results and is particularly aimed at supporting the creation and publication of papers. Equipped with a wealth of tools for producing publication-quality clear graphs, data analysis, and presentations, it facilitates the accurate representation of research findings. It offers a variety of specialized options tailored for scientific and technical use, such as automatic error bars, regression lines, confidence intervals, axis breaks, special axis scales, and nonlinear curve fitting, along with a powerful worksheet that enables robust data manipulation.

  • SigmaPlot_butterflyplot.png
  • SigmaPlot_confidencebands1.png
  • SigmaPlot_violinplot.png
  • Software (middle, driver, security, etc.)
  • Graph Analysis
  • Statistical analysis
  • Graph creation software

Added to bookmarks

Bookmarks list

Bookmark has been removed

Bookmarks list

You can't add any more bookmarks

By registering as a member, you can increase the number of bookmarks you can save and organize them with labels.

Free membership registration

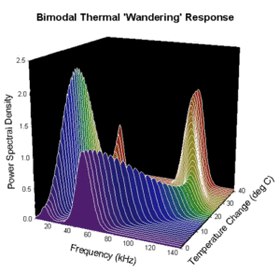
Graph Creation Software 'SigmaPlot' for Pharmaceuticals and Biotechnology

A data analysis and graph creation tool that expresses the results of drug efficacy evaluation in a more understandable way.

In the pharmaceutical and biotechnology industry, particularly in the field of efficacy evaluation research, there is a demand for the creation of graphs that accurately and clearly express experimental results, which can be utilized for paper presentations and reports. It is important to visually capture trends and significant differences in experimental data to demonstrate the validity of the research. SigmaPlot is a graphing software designed to meet these needs for academic research. 【Usage Scenarios】 - Visualization of dose-response curves and pharmacokinetic data in efficacy evaluation - Clarification of significant differences through graphical representation of statistical analysis results - Creation of high-quality graphs for papers and conference presentations 【Benefits of Implementation】 - Accurate and clear communication of research findings - Contribution to an increase in paper acceptance rates - Support for rapid decision-making based on data Basic Operations of SigmaPlot (Link to Hulinks page) https://www.hulinks.co.jp/software/sigmaplot/sigmaplot_bso_guide/

  • SigmaPlot_butterflyplot.png
  • SigmaPlot_confidencebands1.png
  • SigmaPlot_violinplot.png
  • Software (middle, driver, security, etc.)
  • Graph Analysis
  • Statistical analysis
  • Graph creation software

Added to bookmarks

Bookmarks list

Bookmark has been removed

Bookmarks list

You can't add any more bookmarks

By registering as a member, you can increase the number of bookmarks you can save and organize them with labels.

Free membership registration

Search Keywords Related to Graph creation software